- Housing Demand – Growth in online search activity
- Home Price – Growth in asking prices
- Housing Supply – Growth of new listings
- Pace of Sales – Difference in time-on-market
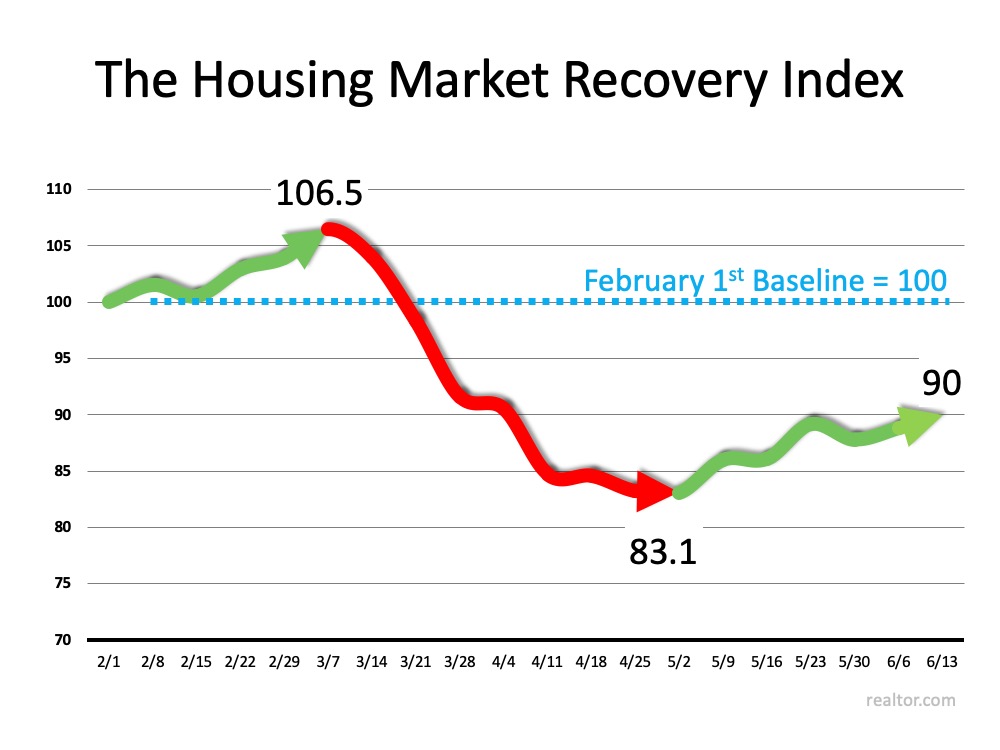
The graph below charts the index by showing how the real estate market started out strong in early 2020, and then dropped dramatically at the beginning of March when the pandemic paused the economy. It also shows the strength of the recovery since the beginning of May.
It’s clear to see that the housing market is showing promising signs of recovery from the deep economic cuts we experienced earlier this spring. As noted by Dean Mon, Chairman of the National Association of Home Builders (NAHB):
“As the nation reopens, housing is well-positioned to lead the economy forward.”The data today indicates the housing market is already on the way up.

Comments
Post a Comment